
Statistics
| Incorporation | February 25, 1885 |
| Form of Government | Council-Manager |
| Area (square miles) | 15.87 |
| Elevation | 456 feet |
| Latitude | 44:02:47 N |
| Longitude | 123:01:15 W |
| Employees (excluding Police & Fire) | |
|
Employees (number excluding police & fire)
|
235 |
| Culture & Recreation | |
| 1 | |
| Community Centers | 5 |
| 1 | |
| 46 | |
|
Acreage (including parks, sports parks, linear parks, & recreation facilities)
|
About 1,500 |
| 2 | |
|
Tennis Courts
|
12 |
|
Teen Centers
|
1 |
|
Fitness Centers
|
3 |
| 1 | |
| City of Springfield Facilities | |
|
Streets (miles) |
266.7 |
|
Street Lights |
4,038 |
|
Traffic Signals |
64 |
| Fire Protection | |
|
Springfield Stations
|
5 |
|
Fire Personnel & Officers
|
99 |
|
Fire Calls Answered
|
416 |
|
Medical Calls
|
11,433 |
| FY14 Annual Report | |
| Police Protection | |
|
Stations – Springfield Justice Center
|
1 |
|
Police Personnel & Officers
|
68 sworn, 55 civilian |
|
Calls for Service
|
47,817 |
|
Dispatched Calls
|
45,185 |
|
Incident Reports
|
10,850 |
|
Arrests
|
5,981 |
| Traffic Violations | 7,749 |
| Sewage System | |
|
Sanitary Sewers (miles)
|
229 |
|
Stormwater Pipe (miles)
|
206 |
|
Treatment Plants (Regional Facility)
|
1 |
|
Wastewater/Stormwater Service Accounts
|
19,000 |
|
Daily Average Treatment (gallons)
|
32 mgd |
|
Maximum Hydraulic Capacity of Treatment Plant
|
277 mgd |
|
Maximum Daily Capacity of Secondary Treatment
|
165 mgd |
| Water System | |
|
Water Mains (miles)
|
220 |
|
Wastewater/Stormwater Service Accounts
|
19,000 |
|
Fire Hydrants
|
1,205 |
|
Daily Average Consumption (gallons)
|
8.2 mgd |
|
Maximum Daily Capacity of Treatment Plant (gallons)
|
277 mgd |
| Education | |
|
Elementary Schools (grades K-5)
|
16 |
|
Elementary School Instructors
|
319 |
|
Secondary Schools (grades 6-12)
|
7 |
|
Secondary School Instructors
|
300 |
|
Alternative Education Schools (grades 6-12)
|
2 |
|
Community Colleges
|
1 |
| 4-year universities and colleges (Springfield & Eugene) | 5 |
| Hospitals | |
|
Hospitals
|
2 |
|
Patient beds
|
500 |
| Airports | |
| Certified for carrier operations (nearest to Springfield) | 4 |
| Mahlon Sweet Field (approx. 17 miles; Eugene, OR; ID: EUG) | |
| Corvallis Municipal (approx. 36 miles; Corvallis, OR; ID: CVO) | |
| McNary Field (approx. 59 miles; Salem, OR; ID: SLE) | |
| Portland International Airport (approx. 123 miles; Portland, OR; ID: PDX) | |
| Other public-use airports (nearest to Springfield) | 3 |
| Hobby Field (approx. 10 miles; Creswell, OR; ID: 77S) | |
| Cottage Grove State (approx. 19 miles; Cottage Grove, OR; ID: 61S) | |
| Lebanon State (approx. 33 miles; Lebanon, OR; ID: S30) | |
Sources: City Finance, Fire, Police, and Public Works departments; Springfield School District #19; Willamalane Parks and Recreation District; McKenzie Willamette Hospital; PeaceHealth Hospital; and Springfield Utility Board. Last updated December 17, 2008.
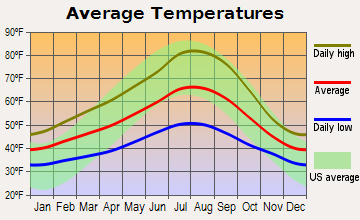
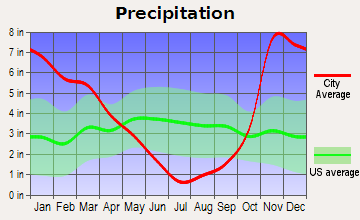
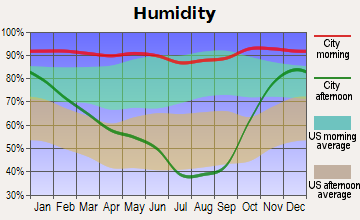
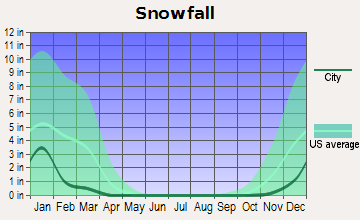
Climate
Average relative humidity is 74% at 10 a.m. and 60% at 4 p.m. Thunderstorms occur infrequently throughout the year, averaging five annually. Over the last 30 years, Springfield’s average annual rainfall is approximately 46 inches (117 centimeters) and monthly average temperatures, precipitation, and snow fall are depicted in the charts below.
Population History and Projections
| Year | Lane County | Metro | Springfield | Eugene | ||
| ———— | ————— | Percent Change |
Annual Average% |
—————- | —————— | ————- |
| 1910 | 33,783 | – | – | – | 1,838 | 9,009 |
| 1920 | 36,166 | – | – | – | 1,855 | 10,593 |
| 1930 | 54,593 | – | – | – | 2,364 | 18,901 |
| 1940 | 69,096 | – | – | – | 3,805 | 20,838 |
| 1950 | 125,776 | – | – | – | 10,807 | 35,879 |
| 1955 | 133,553 | – | – | – | 12,500 | 44,406 |
| 1960 | 162,890 | – | – | – | 19,616 | 50,977 |
| 1965 | 198,000 | 21.55 | 3.98 | – | 23,500 | 72,600 |
| 1970 | 215,401 | 8.79 | 1.70 | 156,941 | 26,874 | 79,028 |
| 1975 | 241,800 | 12.26 | 2.34 | – | 34,900 | 94,600 |
| 1980 | 275,226 | 13.82 | 2.62 | 197,632 | 41,621 | 105,664 |
| 1985 | 269,500 | -2.08 | -.42 | – | 40,690 | 106,100 |
| 1990 | 282,912 | 4.98 | .98 | 204,359 | 44,683 | 112,669 |
| 1995 | 301,900 | 6.71 | 1.73 | 223,340 | 49,005 | 121,905 |
| 1998 | 313,000 | 1.29 | – | – | 51,700 | 133,460 |
| 2007 | 339,870 | – | – | – | 57,320 | 143,910 |
| Projections assuming Springfield=16%, Eugene=40% of Lane County | ||||||
| 2000 | 330,000 | 7.07 | 1.38 | 240,700 | 52,800 | 132,000 |
| 2005 | 352,300 | 6.76 | 1.32 | 257,400 | 56,370 | 140,920 |
| 2010 | 381,000 | 8.15 | 1.58 | 277,600 | 60,960 | 152,400 |
| 2015 | 413,300 | 8.48 | 1.64 | 301,400 | 66,130 | 165,320 |
| 2020 | 374,258 | 7.69 | 1.48 | 325,400 | 70,621 | 194,721 |
| 2025 | 384,530 | 1.8 | 1.48 | – | 71,884 | 202,065 |
| 2030 | 396,195 | 1.7 | 1.48 | – | 73,132 | 210,474 |
| 2035 | 407,420 | 1.8 | 1.48 | – | 74,421 | 218,425 |
| 2040 | 417,901 | 1.6 | 1.48 | – | 75,579 | 226,078 |
Projections prepared by Portland State Population Research Center
Demographics
|
Population Age Groups
|
||||||
| 1960 | 1970 | 1980 | 1990 | 2000 | 2010 | |
| Under 5 years | 2,444 | 2,709 | 4,184 | 3,929 | 4,327 | 4,338 |
| 5-19 years | 5,954 | 7,790 | 9,495 | 9,745 | 11,585 | 11,688 |
| 20-44 years | 6,378 | 9,345 | 18,654 | 19,468 | 20,983 | 21,659 |
| 45-64 years | 3,546 | 4,960 | 5,808 | 6,733 | 10,546 | 14,843 |
| 65+ years | 1,294 | 2,243 | 3,480 | 4,808 | 5,423 | 6,875 |
| Median Age | 25 years | 25 years | 26 years | 30 years | 32 years | 34 years |
Source: 2006-2010 American Community Survey
Housing
| Percent built 2000 to 2009: | 8.80% |
| Percent built 1990 to 1999: | 16.40% |
| Percent built 1980 to 1989: | 7.20% |
| Percent built 1970 to 1979: | 32.80% |
| Percent built 1969 or earlier: | 34.70% |
| 1970 | 1980 | 1990 | 2000 | 2010 | |
| Total Housing Units | 10,851 | 17,469 | 18,121 | 21,500 | 24,411 |
Source: 2006-2010 American Community Survey

Data source: RMLS
Agricultural Products
(Top 4 largest gross farm sales)
| – Specialty Crops |
|
|
| – Vegetable Crops |
| – Grass & Legume Seeds |